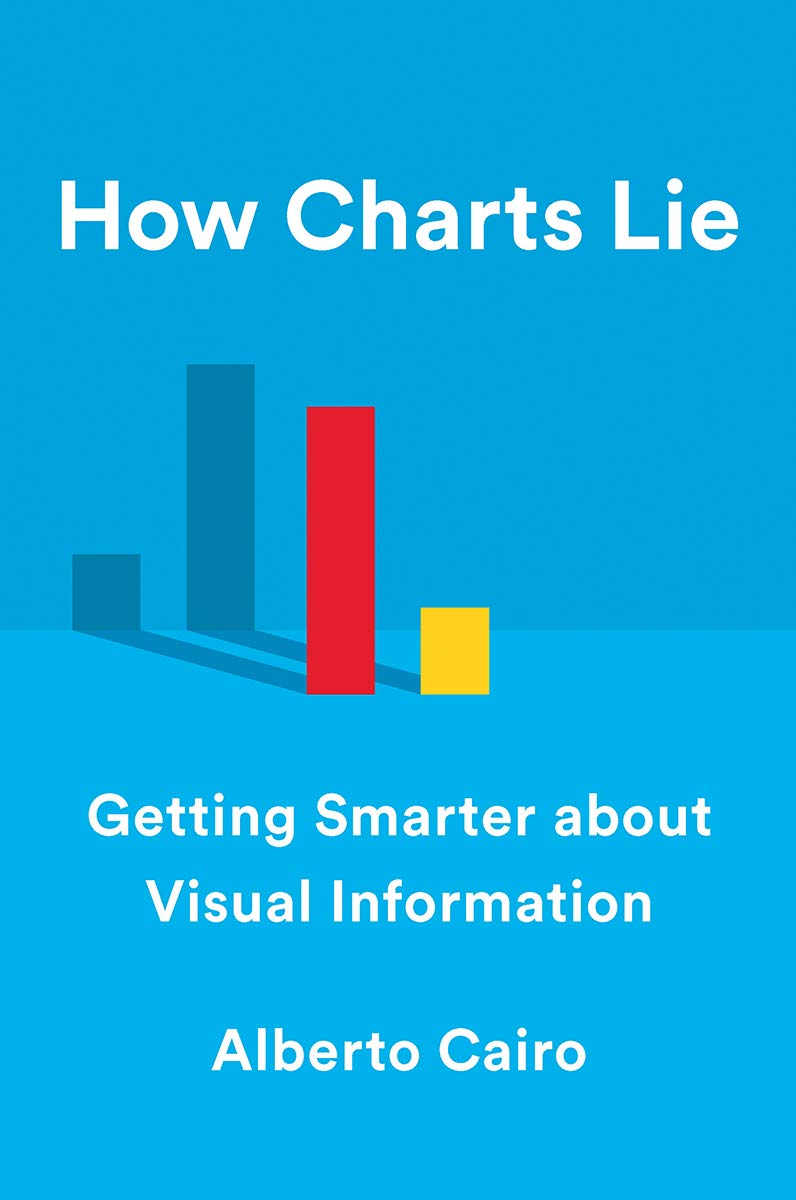
How Charts Lie - Getting Smarter about Visual Information
图表如何说谎-更加智能地了解视觉信息
政治经济学售 价:
¥
188.00
发货周期:现货48小时
作 者
出 版 社
出版时间
2019年11月19日
装 帧
平装
页 码
256
开 本
16.3 x 2.3 x 24.4 cm
语 种
英文
综合评分
暂无评分
- 图书详情
- 目次
- 买家须知
- 书评(0)
- 权威书评(0)
图书简介
Social media has made charts, infographics and diagrams ubiquitous- and easier to share than ever. While such visualisations can better inform us, they can also deceive by displaying incomplete or inaccurate data, suggesting misleading patterns or misinform by being poorly designed.
Many of us are ill equipped to interpret the visuals that politicians, journalists, advertisers and even employers present each day, enabling bad actors to easily manipulate visuals to promote their own agendas. Public conversations are increasingly driven by numbers and to make sense of them, we must be able to decode and use visual information. By examining contemporary examples ranging from election-result infographics to global GDP maps and box-office record charts, How Charts Lie teaches us how to do just that.
本书暂无推荐
本书暂无推荐


