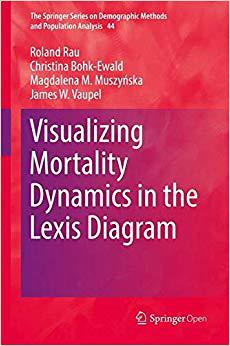
Visualizing Mortality Dynamics in the Lexis Diagram(The Springer Series on Demographic Methods and Population Analysis)
雷克斯图的可视化死亡动力学
人口学售 价:
¥
639.00
发货周期:外国库房发货,通常付款后3-5周到货
作 者
出版时间
2017年11月23日
装 帧
精装
页 码
169
语 种
英文
综合评分
暂无评分
- 图书详情
- 目次
- 买家须知
- 书评(0)
- 权威书评(0)
图书简介
This book visualizes mortality dynamics in the Lexis diagram. While the standard approach of plotting death rates is also covered, the focus in this book is on the depiction of rates of mortality improvement over age and time. This rather novel approach offers a more intuitive understanding of the underlying dynamics, enabling readers to better understand whether period- or cohort-effects were instrumental for the development of mortality in a particular country. Besides maps for single countries, the book includes maps on the dynamics of selected causes of death in the United States, such as cardiovascular diseases or lung cancer. The book also features maps for age-specific contributions to the change in life expectancy, for cancer survival and for seasonality in mortality for selected causes of death in the United States. The book is accompanied by instructions on how to use the freely available R Software to produce these types of surface maps. Readers are encouraged to use the presented tools to visualize other demographic data or any event that can be measured by age and calendar time, allowing them to adapt the methods to their respective research interests. The intended audience is anyone who is interested in visualizing data by age and calendar time; no specialist knowledge is required.This book is open access under a CC BY license.
本书暂无推荐
本书暂无推荐


