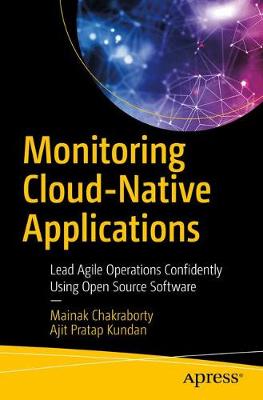
Monitoring Cloud-Native Applications:Lead Agile Operations Confidently Using Open Source Software
监控云原生应用程序:自信地使用开源软件领导敏捷运营
计算机软件
¥
648.00
售 价:
¥
486.00
优惠
人工智能领域图书专题
发货周期:预计8-10周发货
出 版 社
出版时间
2021年04月26日
装 帧
平装
页 码
245
语 种
英文
综合评分
暂无评分
- 图书详情
- 目次
- 买家须知
- 书评(0)
- 权威书评(0)
图书简介
Introduce yourself to the nuances of modern monitoring for cloud-native applications running on Kubernetes clusters. This book will help you get started with the concepts of monitoring, introduce you to popular open-source monitoring tools, and help with finding the correct set of use cases for their implementation. It covers the in-depth technical details of open-source software used in modern monitoring systems that are tailor made for environments running microservices. Monitoring Cloud-Native Applications is divided into two parts. Part 1 starts with an introduction to cloud-native applications and the foundational concepts of monitoring. It then walks you through the various aspects of monitoring containerized workloads using Kubernetes as the de-facto orchestration platform. You will dive deep into the architecture of a modern monitoring system and look at its individual components in detail.Part 2 introduces you topopular open-source tools which are used by enterprises and startups alike and are well established as the tools of choice for industry stalwarts. First off, you will look at Prometheus and understand its architecture and usage. You will also learn about InfluxDB, formerly called TICK Stack (Telegraf, InfluxDB, Chronograf, and Kapacitor). You will explore the technical details of its architecture and the use cases which it solves. Your next stop will be Elastic Stack, formerly known as the ELK Stack (ElasticSearch, LogStash, and Kibana) and you will examine the scenarios where you can use it effectively. In the next chapter, you will be introduced to Grafana, a multi-platform open source analytics and interactive visualization tool that can help you with visualization of data and dashboards. After reading this book, you will have a much better understanding of key terminologies and general concepts around monitoring and observability. You will also be able to select a suitable monitoring solution from the bouquet of open-source monitoring solutions available for applications, microservices, and containers.Armed with this knowledge, you will be better prepared to design and lead a successful agile operations team.What You Will LearnMonitor and observe of metrics, events, logs, and tracesCarry out infrastructure and application monitoring for microservices architectureAnalyze and visualize collected dataUse alerting, reporting, and automated actions for problem resolutionWho This Book Is For DevOps administrators, cloud administrators, and site reliability engineers (SREs) who manage and monitor applications and cloud infrastructure on a day-to-day basis within their organizations.
本书暂无推荐
本书暂无推荐


